6 What’s the Big Deal about Big Data? Learning Analytics and the Scholarship of Teaching, Learning, and Student Success
Charmian Lam; George Rehrey; Linda Shepard; Michael Sauer; and Jeremy Herhusky-Schneider
Introduction
During the past decade, the use of learning analytics (LA) in higher education has evolved from an emergent field to a well-established aspect of higher education’s ecosystem (Lodge et al., 2019). The purpose of this chapter is to inform SoTL practitioners about how they could use LA to expand the possibilities of what can be known about their students and curriculum, connecting their current practices with large, robust, quantitative datasets that provide new kinds of evidence of student learning.
We start by defining LA and student success before providing a brief overview of our Learning Analytics Fellows (Fellows) program (Rehrey et al., 2019; Shepard et al., 2019). What follows is an overview of organizational change as our theoretical framework. We then share the results of a qualitative analysis of the program, the limitations of our study, and a discussion about its implications. We conclude by recommending evidence-based steps that educators and educational technologists could take to use LA in their SoTL projects.
The difficulty with finding a term that captures how massive and complex datasets are being employed in higher education rests with how fast the field has grown and evolved since the term LA was initially defined by the Society for Learning Analytics Research (SoLAR, 2011). For our purposes, we define the term LA to include both learning analytics and academic analytics as originally defined by Long and Siemens (2011). This includes “any and all data that can be analyzed and acted upon to improve student success” (Rehrey et al., 2020, p. 222), and that can be categorized as reported data, automatically recorded data, data derived from other data, and inferred data that makes correlations between datasets (Sclater, 2017). Most LA are derived from the learning management system, but they can also be located in other educational technology tools software, such as polling software.
We use the term student success to mean that “students persist, benefit in desired ways from their college experience, are satisfied with college, and graduate” (Kuh et al., 2017, pg. xii). Thus, students will have experienced purposeful educational activities and attained their own objectives for attending college.
The Learning Analytics Fellows Program
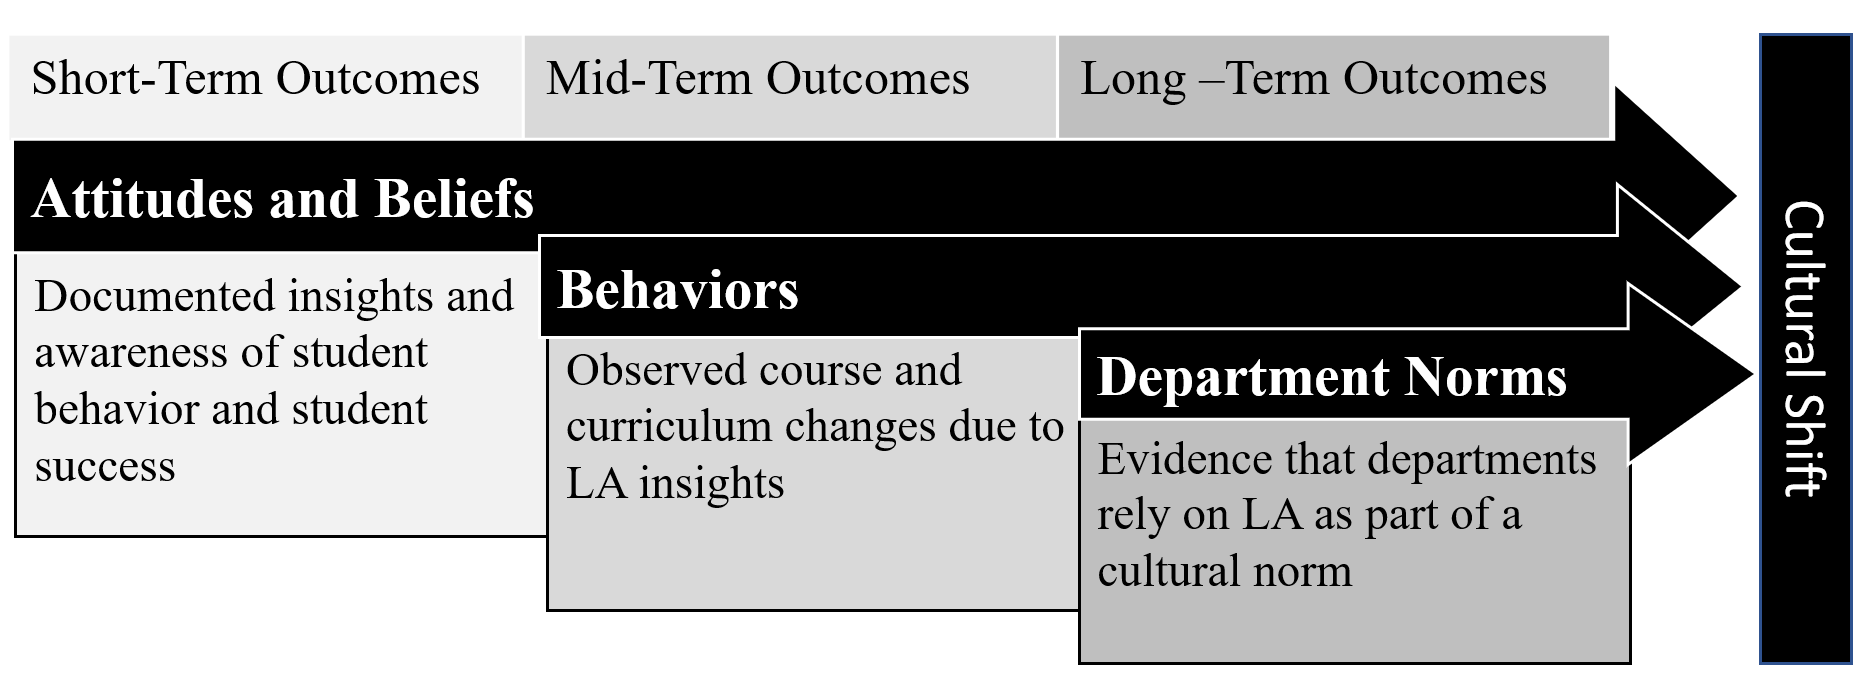
The purpose of the Fellows program is to shift the teaching and learning cultures in departments and programs throughout our institution, moving faculty who are not usually involved in our SoTL program from anecdotal storytelling about their students to one that is quantitative and evidenced-based (Rehrey et al., 2018). From its inception, we understood that departmental-level change would require a long-range plan, like the one advocated for by the Association of American Universities in 2017 that claims systemic departmental change takes 5–7 years to accomplish. Similarly, Corbo et al. (2016) suggested in their findings that the “improvement of higher education requires more than the development of new teaching strategies; it requires systemic, cultural change” (p. 12). Based upon those earlier findings, we developed our own framework of short-term, mid-term, and long-term program outcomes, with cultural shift as the ultimate goal (Figure 6.1).
Cultural change in higher education is difficult to study due to a unique combination of “decentralized structures, institutional status and image, shared governance, and the often-conflicting interests of various stakeholders” (Kezar, 2001, p.vi, p.55). However, the first step to change is to examine how institutional culture and type may influence potential change (Kezar & Eckel, 2002). Established in 2015, the Fellows program was originally modeled after the SoTL grants program at Indiana University Bloomington (IUB), which is a large, public, selective institution with very high research activity in the United States (Carnegie Classifications, 2024). Over the past 7 years, Fellows have represented a diverse cross-section of the IUB teaching and learning community (Figure 6.2). Fellows join the program voluntarily by submitting a proposal indicating their research questions and what they hope to accomplish in the coming year.
Typically, our LA Fellows conduct SoTL research using large complex datasets. Instead of studying a small number of courses or students over a relatively limited time span, Fellows have access to tens of thousands of (anonymized) student records and all the courses taught at IUB, spanning over a decade. The data is from our student information systems warehouse, rather than learning management systems (LMS). The datasets provided to Fellows represent the student’s academic experience, including variables about admissions such as academic preparation (e.g., high school GPA, SAT/ACT), data about student academic progress (coursework, major transitions, grades), demographic information (e.g., gender, ethnicity, residency), and some information about student life (e.g., residential programs, student activities, student associations), student economic status, and student outcomes (degree information, job placement). This data is cleaned, anonymized, and provided by our institution’s assessment and research unit.
As an example of what can be accomplished, one of the Fellows’ projects concerned the records of approximately 31,192 undergraduate students enrolled at IU-Bloomington in the Spring semester of 2020. In their project, Satisfactory Grade Option: Choice Determinants and Consequences, Xiao and Kaganovich (2020) analyzed 130,725 grade records. Their project analyzed the outcomes of IUB’s unique grading policy option that was made available to students in the spring semester of 2020. To mitigate the disruptions from the emergent pandemic, students were given the option to replace their standard letter grade with an “S” (satisfactory). Results from five different sets of multinomial logistic regressions found that students with a lower prior GPA before the pandemic were more likely to choose “S” in each course they enrolled in. This finding was contrary to the notion that the adverse effect of a given letter grade in a Spring 2020 course would be more detrimental to a student with a higher prior GPA.
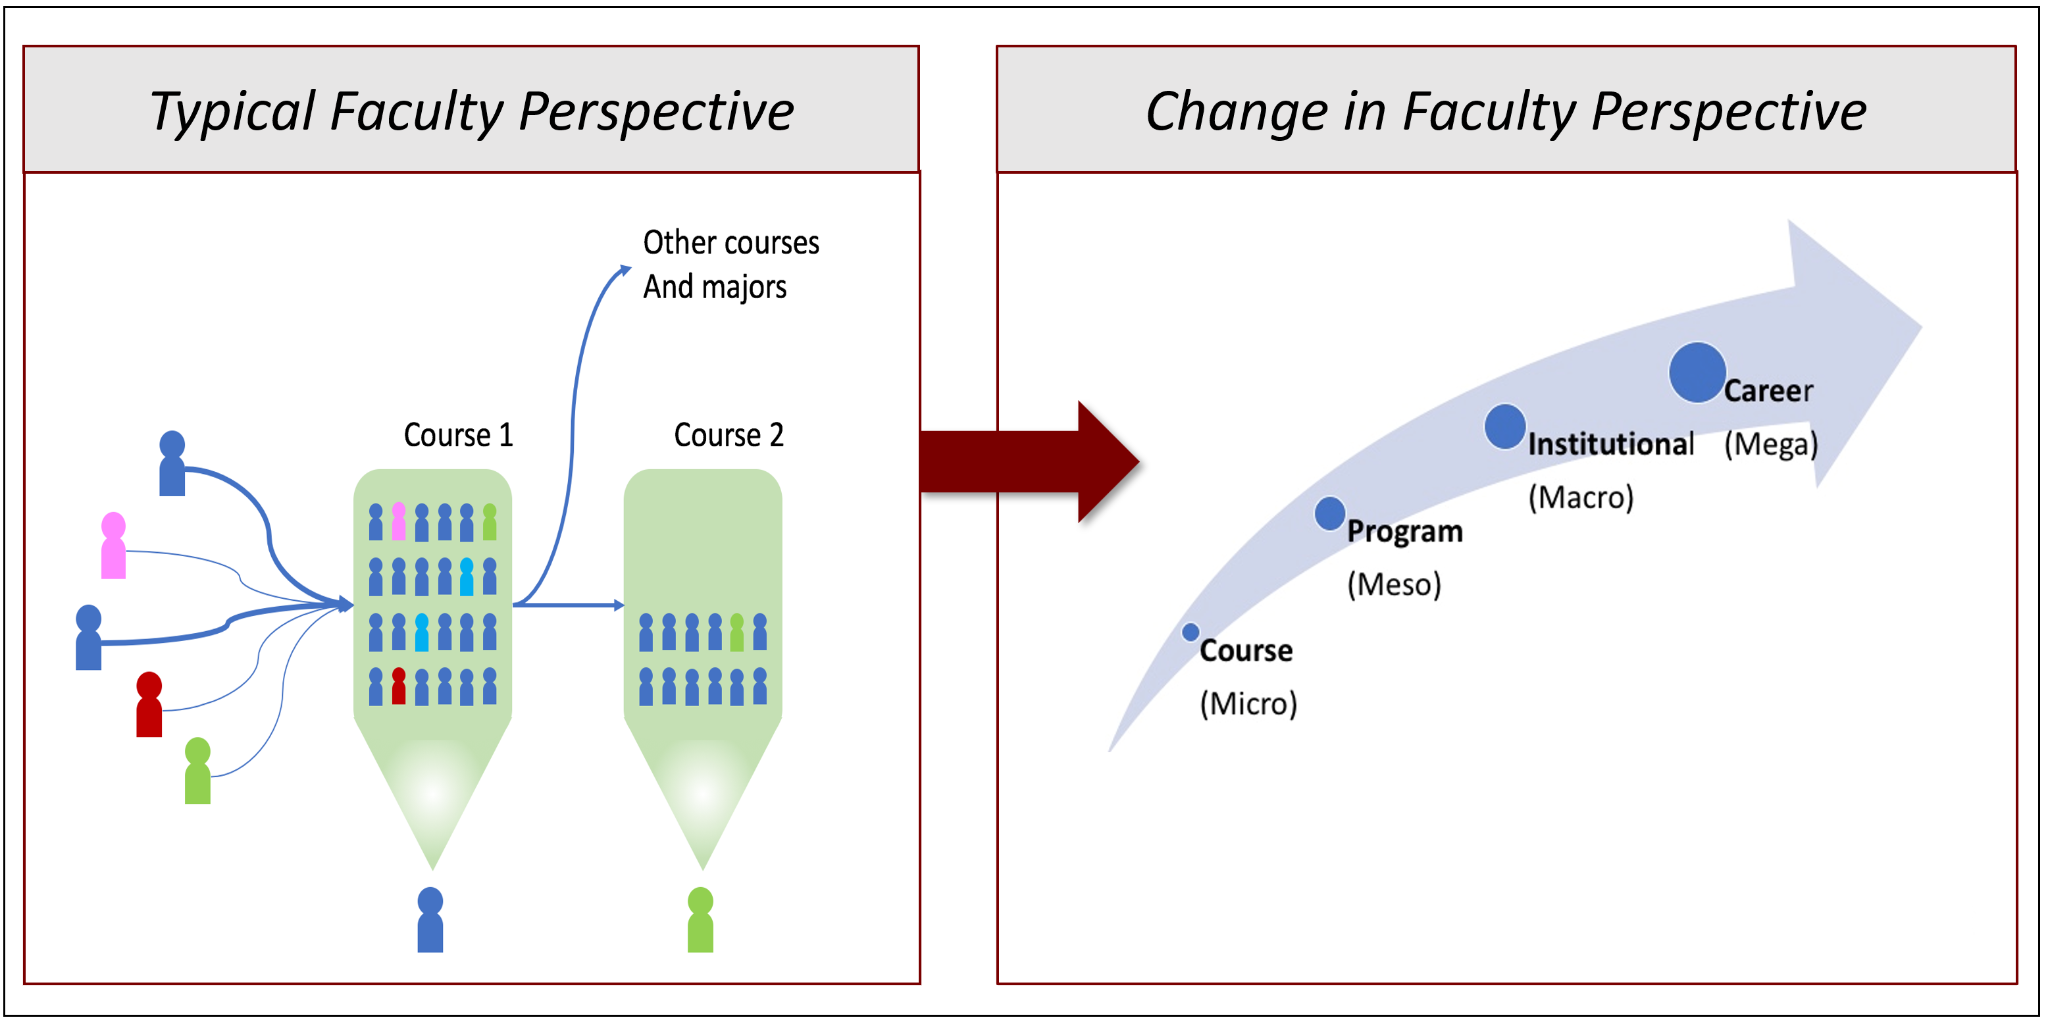
Figure 6.3 illustrates what we have observed with the Fellows over time, as they move from the micro (course) to the mega (institutional) level (Poole & Simmons, 2013) with their scholarly research. This aligns with another goal of the program—to expand the scope of SoTL projects, providing opportunities for faculty to become aware of how they influence and affect student performance and success beyond what occurs in their individual courses and programs. The left pane illustrates the relatively shallow idea of what happens to students after a course that faculty may hold about students in large introductory courses. There is even less knowledge of what happens to students throughout their college career as they make significant and potentially life-long decisions.
After we introduced LA to the SoTL practitioners on our campus, faculty were able to better use statistical results and data visualizations to holistically understand factors and patterns of student behaviors beyond the classroom (Rehrey et al., 2019). Interest in patterns of student behavior can be observed in the types of research questions that were asked in faculty projects. This included interest in student performance in upstream and downstream courses, in required courses outside their major, as well as comparisons in student performance in difficult science courses compared to their overall performance in all the other coursework. These observations stemmed from our roles as LA and SoTL facilitators, and this study was designed to identify empirical evidence while acknowledging our research subjectivity and delving deeper into how LA and SoTL may shift teaching and learning academic culture. Our approach and research questions were also informed by the following theoretical framework and research methodology.
Research Paradigm and Theoretical Framework
Kezar and Eckel (2002) recommended that organizations realize their own institutional culture through self-discovery. Following a cursory Fellows program review as part of routine administration in the previous section, we, therefore, designed this study for a deeper understanding of how SoTL, infused with LA data, can change teaching and learning cultures in academic programs. Kezar’s work on organizational change was used to frame our understanding of the structures and mechanisms that influence and prevent institutional change.
The critical realist perspective best aligned with our understanding of the research site and our theory of change (Figure 6.1). This perspective allowed us to consider the multifaceted nature of an organization’s cultural change, accounting for both measurable outcomes and the nuanced, subjective realities of individuals within the institution (Bogna et al., 2020). The measurable program outcomes discussed in the previous section (e.g., number of faculty Fellows participating and completed research projects) were surface-level observations that reflected the myriad influences of institutional structures and mechanisms that drive or resist change. These outcomes, structures, and mechanisms are simultaneously heavily influenced by social, cultural, and individual interpretations of working with big data and the value of SoTL research. In our study, we sought to more empirically review the Fellows’ research projects while complicating our understanding with subjective, individual perceptions of comfort with using big data and the value of SoTL research. A critical realist perspective best reflects our conception of how LA-informed SoTL projects may influence teaching and learning cultures because it supports examinations of subjective, social actors in the context of systems that constrain and facilitate their agency (Miller-Young, in press). However, an empirical qualitative approach was taken for this particular study (neopositivist inductive paradigm, see Chapter 2).
Next, Kezar’s work on organizational change was most influential in considering the institutional factors at play in higher education that may influence how individual choice to pursue LA-informed SoTL research affects cultural change in teaching and learning. Kezar (2001) also underscored the importance of integrating empirical research with deep knowledge of institutional culture and human agency. Successful, sustainable change requires an understanding of both structural and cultural dimensions of institutions. Kezar (2001) argued that change is inherently complex within higher education due to unique factors such as shared governance, decentralized structures, and the diverse goals of faculty, staff, and administrators. As such, initiatives that promote change should be adaptable, context-specific, and inclusive of multiple perspectives, rather than those that are top-down and generic (Kezar, 2001, p. 123).
Though this study is not an exhaustive and comprehensive review of institutional factors that promote or resist change, we analyzed our data within the context of our own institutional culture. Our positions as facilitators of big data, LA-informed SoTL was an asset, given Kezar’s empowering focus on promoting specific, context-dependent change through an understanding of the institutional culture within.
Research Questions
We sought answers to the following questions about the Fellows program:
- What kinds of LA projects do faculty propose and how do they change over time with repeat participation in SoTL projects using big data?
- How do faculty describe their experience in the LA Fellows Program?
Research Methods
We took a qualitative, empirical approach to this study (Yeo et al., 2023). Our questions were addressed by collecting and analyzing two sources of data: project completion reports and focus group transcripts. All data was collected and managed using appropriate confidentiality and ethical guidelines as approved by the university’s institutional review board.
Data Generation
First, all fellows (2015–2021), as a regular step in finishing the program, completed a summary report of their findings and reflections on the impact of using LA data on their research and teaching practices. These reports were used as a data source to understand how faculty were using the data and the types of questions that were being addressed (n = 57 reports). Faculty reports were analyzed using content analysis (Yeo et al., 2023). Each faculty report was coded independently by two authors and then compared and discussed until agreement was reached to increase inter-researcher reliability (Lattuca & Domagal-Goldman, 2007). The coding categories were: faculty discipline, number of students in sample, whether faculty were repeating participants (y/n), the scope of their research (classroom, departmental, institutional, or regional), topics of research project (32 categories), student learning outcomes investigated in the study (18 categories), variables in the study (47 categories), study research methods (3 categories), study outcomes (5 categories), and themes from their reflection on participating in the LA Fellows Program. By aggregating faculty reports across seven cohorts, we added reliability to inferences about influential components of the LA fellowship on shifting teaching and learning cultures.
Second, three focus groups were conducted by the research team with a subset of volunteer participants (n = 7) to gather information from the Fellows about their experiences in the program and hear details about the benefits and barriers surrounding their participation. The sessions were audio-recorded and transcribed for analysis. Transcripts were analyzed using empirical thematic analysis (Braun & Clarke, 2006). Each researcher read and coded all three transcripts with RQ2 in mind. Two researchers then collated the codes into relevant themes that answered RQ2.
Data Analysis
In the analysis of both the focus groups and the faculty reports (discussed in the next paragraph) where we encountered challenges regarding inter-rater reliability, we used several rounds of group norming to agree on specific definitions for some concepts and variables. We held meetings during which we discussed our understanding of each code, and each reviewer re-examined their previous codes and made changes accordingly. Resolving our initial differences in code constructs resulted in overall greater clarity and confidence in results.
Results
Between 2015 and 2021, 69 research teams engaged in Fellows’ research, 12 teams had not submitted a completion report at the time of this study, and we have 57 completion reports. It is possible for multiple faculty members to collaborate on a single project and faculty can participate for multiple years. Table 6.1 provides a summary of the data that Principal Investigators provided in their faculty reports: their academic discipline, and scope of their research or focus of their project outcomes.
| Totals | Count | % |
|---|---|---|
| Total Unique Participants | 69 | 100 |
| Total Projects in Study | 57 | 100 |
| Project Discipline | Count | % |
| Academic Support | 7 | 12.28 |
| Business | 8 | 14.04 |
| Humanities | 12 | 21.05 |
| Professional Schools | 6 | 10.53 |
| Social Science | 17 | 29.82 |
| STEM | 7 | 12.28 |
| Project Scope | Count | % |
| Course | 20 | 35.09 |
| Departmental/Program | 23 | 40.35 |
| Institutional | 13 | 22.81 |
| Regional and Up | 1 | 1.75 |
Completion Report Results
Not all Fellows’ projects contained research questions, but all contained the topics of study, the educational outcomes studied, and the methods. Codes in the faculty completion reports (n = 57) represented the main topic of the project, the educational outcomes that were studied, and their plans of action following participation in the program. The top three topics regarding teaching, learning, and student success were academic performance defined as grades/GPA (n = 37); effectiveness of a course curriculum (n = 20); and student choice of major (n = 19).
One example of the first topic, academic performance defined as grades/GPA Factors, was a project completed in 2020 titled “Determining Student Success in Downstream Courses from Business Statistics.” The study was classified as “departmental/programmatic” level by the authors of this chapter. Data about 3,000 undergraduates on their resident status (in/out of state), gender, Pell grant recipient status, first or multi-generation status, student final course grades, and source of course prerequisites (standardized exams, community college credit or same-institutional credit) was used in this study. One course-level project from 2016 on the effectiveness of a course curriculum topic was titled “The Impact of “Becoming the Best Student” and “You@IU” Courses on Retention, Graduation, GPA, and Student Lives More Generally.” In it, the researcher analyzed data from 4,780 undergraduates about their ethnicity or race, gender, international residency status, major, Pell grant recipient status, first or multi-generational status, and final course grades. One institutional-level project from 2020 on the topic of student choice of major was “Grade Expectations in Introductory Courses and the Effects on the Corresponding Majors.” Data from 17,890 undergraduates on their course grades, choice of major, college GPA, course selections, in-state residency status, ethnicity or race, gender, timing of changes of major, Pell grant recipient status, and first or multi-generational status were used in this project.
The top educational outcomes included course grades including Drop, Fail, and Withdrawals (DFW) (n = 28); college GPA (n = 19); and retention (n = 11). Faculty reports included plans of action following the fellowship year. The most common outcomes of participation in the program were sharing with colleagues in both formal meetings and informal conversations, proposals for future studies (in subsequent years in the program and externally), a presentation of findings at a conference, and/or data-informed curricular redesign.
Projects that concern diversity, inclusion, and equity (DEI) were reflected in half of the faculty reports. Of all the coded reports (n = 57), 20 reports either explicitly mentioned or implied relevance to DEI issues, seven featured DEI as a foundational part of their study, and 26 did not include DEI. An aggregated account of 27 reports studied a variety of DEI topics, such as financial need, international student status, race, and gender gaps in classroom performance (e.g., grade distribution, exam performance), retention in the major/program, and post-graduate job outcomes. DEI issues were consistently present in all program years (2015–2021). Nine out of 10 projects in STEM fields included or mentioned DEI.
Of note are the evolution of projects from faculty who participated multiple times (Table 6.2). Thirty faculty served as PIs to 57 projects; 15 PIs participated at least twice. These faculty tended to refine their topics and evolve their understanding of student learning. More specifically, faculty had more broad, exploratory topics in their initial year(s) and then dove deeper into topics with specific variables in subsequent years. Some even expanded impact levels from micro (individual level) to macro (institutional level) (Poole & Simmons, 2013) as their involvement in the Fellows program progressed. Given the constraints on space, Table 6.2 provides project details for three representative faculty who were selected based on diversity of fields (social science, humanities, and business), and they were among those who participated the most years in a row.
| Year | Title | Impact Level |
|---|---|---|
| 2016 | Determinants of Students’ Choices of Undergraduate Majors and Programs’ Strategies: The Factors of Differential Grading Standards across Academic Units | Departmental/Program |
| 2017 | The Factors of Differential Grading Standards across Academic Units | Departmental/Program |
| 2018 | Gender Differences in Persistence in a Field of Study | Institutional |
| 2019 | Changing Course or Dropping out: the Gender Factor | Institutional |
| 2020 | Means and Ways: the Interaction of Family Income and Gender in Academic Field Selection and Persistence | Institutional |
| Year | Title | Impact Level |
|---|---|---|
| 2017 | Exploring relationships between the New Indiana Academic English Test (IAET) and External Measures | Institutional |
| 2018 | Examining the consequential validity of the new online Indiana Academic English Test (IAET) | Institutional |
| 2019 | Exploring determinants of international students’ academic performance using longitudinal data analysis | Institutional |
| 2020 | Improving placement accuracy and efficiency of incoming international students into ESL support courses | Institutional |
| Year | Title | Impact Level |
|---|---|---|
| 2017 | The Factors to and Impact of [300-level business course] Success | Course |
| 2018 | Finding the Keys to Success in Business [200 level course] | Departmental/Program |
| 2019 | Major Declaration and Degree Earned in [Business] School in 12 Years | Departmental/Program |
| 2020 | Major Switchers and Course Enrollment | Departmental/Program |
| 2021 | Can Degree Earned Be Predicted? | Institutional |
Focus Group Results
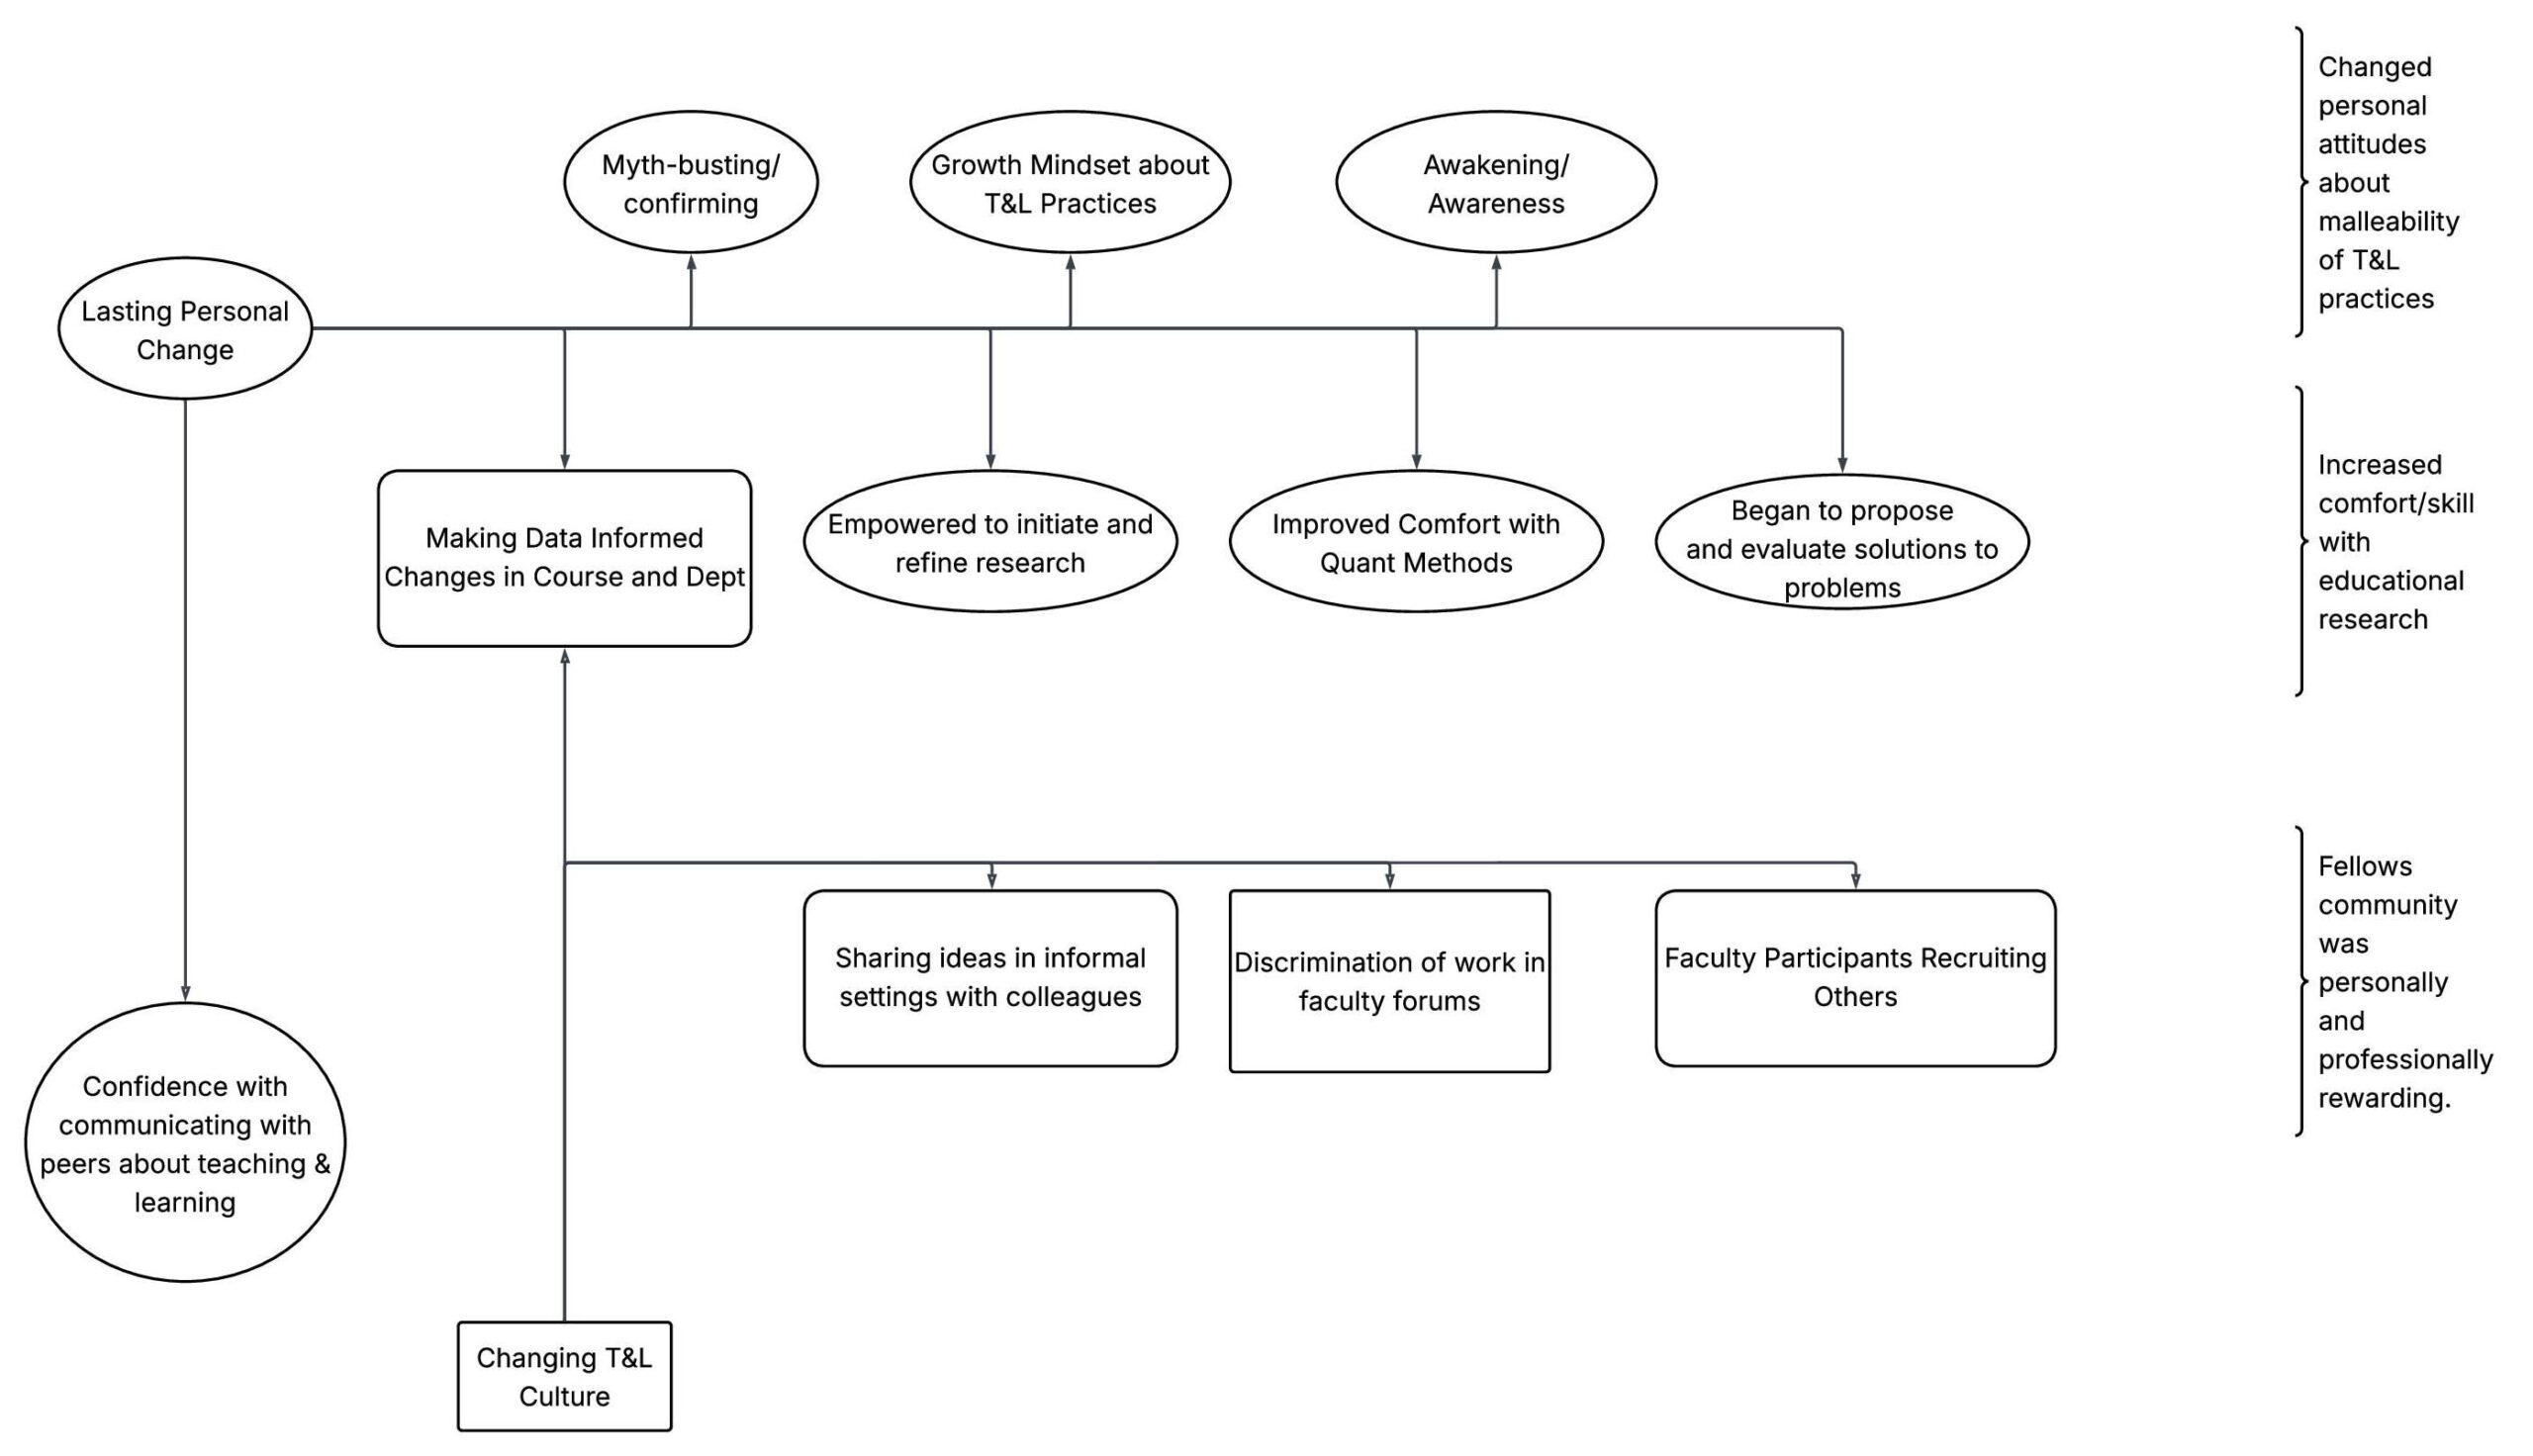
Results from focus groups (n = 7) provide insights into each of the research questions. The most prominent themes highlighted here relate to how and to what extent the lens offered by LA contributes to a culture of evidence-based teaching and learning practices. Figure 6.4 summarizes the results of the Fellows’ comments. Three critical themes frame the faculty experience when provided with LA for their research. First, Fellows describe their initial belief in the power of the data, the ‘a-ha’ moment, of how the results of their research were explained by the data. Second, Fellows describe how the program influenced their professional trajectory for continued participation, or continued alignment with this approach. Was the change in beliefs sustainable? Third, Fellows describe an affinity to the community of Fellows and discuss the role of this community. This theme is most prominent among those who have participated multiple times or remain connected to the Fellows community.
In the first theme, we found that participants reported growth and change in personal attitudes. They cite an “awareness” or “awakening” about how data can be used to inform teaching practices and learning experiences. Some respondents note they previously relied on “myths” about teaching and learning. The projects led to discussions that covered many levels of influence, e.g., changes in course pedagogy, curriculum flow, major changes, and student success at the campus level. One respondent commented that “…it allows me time to figure out what the questions are and allows those questions to develop over time.” Another Fellow summed up the potential for using LA by saying “It was a game changer for us to figure out what’s going on in our classes.” The faculty experienced these changes due to administrative support to improve undergraduate education, which provided data and analytical assistance from institutional research.
These personal changes were described as “impactful” or “lasting.” Faculty reported a desire to propose and evaluate solutions to teaching and learning problems they encountered in their positions. A few participants described an increased comfort with conducting research using student data. Participants also felt more comfortable with quantitative methods, especially those who were from humanities or otherwise did not have statistical training. Participants described feeling empowered to initiate research or refine existing research projects about teaching and learning after their fellowship year. From our provision of analytical support, these outcomes are possible due to institutional support; however, faculty continue to be comfortable in their subsequent usage of data. Comments faculty made in the focus groups supported our findings and demonstrated optimism for improving teaching and learning because of undertaking LA-informed SoTL projects. As one fellow said, “We gain confidence, and the ability to put the microscope on ourselves and our programming.”
Lastly, participants discussed how the Fellows community was personally and professionally rewarding. They disseminated work in formal settings (e.g., conferences, departmental meetings) and informal settings (e.g., emails, “hallway chats”). As one fellow stated, “I got involved with the Fellows program because someone in my department mentioned this program.” In discussing someone else’s project, a fellow mentioned, “I know there’s a lot of effort being put now into trying to figure out a better path for our students who are less prepared. And I think that does come from the study that you did.” Collaborations across departments have been supported by our program and organically emerged through Fellows’ social networks. One Fellow mentions the connections and collaborations he, as an expert in learning sciences, has had with STEM faculty who manage large, difficult classes that are required for STEM and other majors. He stated, “Extended collaborations really need to happen to have this kind of impact. I think these are important for improving pedagogy throughout the University.” Faculty also reported recruiting one another to participate in the LA Fellows program in subsequent years.
Overall, Fellows felt more comfortable and confident about working with big data derived from LA. Fellows who participated for multiple years tended to focus on classroom-based, micro-level outcomes in the early years and departmental- or institutional-level outcomes during the later years.
Limitations
Faithfully addressing the limitations of this study helps to limit the overreach of findings. First, this study describes one program’s attempt to leverage an existing SoTL program’s successful practice to expand and transform the teaching and learning culture at one institution. Second, several program participants did not submit a final summary report, despite receiving requested data and analytical assistance. It was not possible to account for these faculties’ experiences, findings, and potential difficulties in our analysis, possibly biasing our results. Lastly, due to availability in schedules, the focus groups were facilitated by individuals whose institutional roles included administration of the fellowship program. This choice may have biased the focus group respondents’ responses. Additionally, we may never know the experiences of faculty who chose not to participate in focus groups.
The evaluation of the program would benefit from other perspectives. For example, asking department chairs or deans what they know about the program and if the faculty are encouraged to participate, etc. Talking to the administrators of the program or faculty who have attended information sessions about the program but never participated may reveal barriers experienced by some faculty before they even write a proposal.
Discussion
A culture shift that supports evidenced- informed teaching and learning practices as a departmental norm requires time to mature within a large department or at a campus with ~35,000 undergraduate students. The LA Culture Shift Framework (Figure 6.1) presents a heuristic for observing the development of this data-informed culture. In the short term, faculty begin to engage with the LA data as they conduct SoTL. Faculty in the mid-term see the value of their inquiry and respond to the findings by inquiring further, making decisions about new approaches, sharing their work, and/or encouraging others to participate. Finally, in the long term, the framework suggests that work is embedded into a departmental culture as a departmental norm. At this stage, departments expect faculty to be involved in research or a service that improves the success of their students. Departments establish a culture where faculty engage in dialog about their findings and where teaching practices are consistently informed by the evidence of effectiveness obtained by the use of institutional data.
Faculty participating in course-level or departmental level research on student success were the most common in all the years of the program. At the departmental level, Fellows examined factors that influenced the choice of major as well as program retention and recruitment. The Fellows who initiated department-level projects had some administrative responsibilities as part of their faculty position. Diversity, equity, and inclusion were consistent interests across all program years and mostly concerned ethnicity and gender.
Based on the LA Culture Shift framework, Kezar’s work on organizational change, and our data, our findings show progress towards our ultimate goal to shift teaching and learning cultures in academic programs within higher education using LA-informed SoTL projects. Prior to participating in the LA Fellows Program, faculty were more likely to consider student learning from a course-based perspective (Figure 6.3). We found that faculty gained confidence and comfort with working with large data, which will increase the likelihood of their self-driven research into student success in the future. Without data cleaning, preparation, and some coaching in manipulation and visualization, certain fellows expressed disbelief in their ability to conduct their project. Faculty focus group responses also revealed a tendency to be more reflective about their teaching practices after using big data. Comfort in working with large quantitative data was especially important for faculty from the humanistic disciplines or those who were trained as qualitative methodologists. Additionally, Fellows shared their participation in our program and their project’s results in faculty meetings, informal hallway conversations, and professional venues such as conferences. By doing so, faculty were able to recruit their colleagues for subsequent projects with this program, or, at the very least, highlighted the use of LA with their colleagues within and across their departments.
Implications
Becoming comfortable using LA is not trivial, even considering those with experience in quantitative data analysis. The faculty demonstrated a wide range of levels of comfort and experience working with large operationally derived datasets. Some faculty required little support other than the documentation accompanying the datasets available to them and occasional answers to questions about specific variables and how to interpret them. For others, the use and analysis of datasets was a completely novel and sometimes uncomfortable or intimidating experience, and they relied heavily on our assessment and research unit to guide and perform their analysis. This included: joining the institutional datasets to their locally maintained datasets; producing descriptive data visualizations to explore and analyze the data; using propensity score matching to select comparison control populations; and performing ANOVA, linear regression, and logistic regression analyses. They also received assistance with the interpretation of analyses performed when requested.
By its very nature, the support required for SoTL practitioners to obtain and analyze LA is contextual. Every institution has its own formal and informal policies and practices for where, when, and how the data is stored and who controls access to it. Additionally, each country has its own laws about data storage and privacy that consider the security and ethical practices of using personal information for any purpose. For SoTL practitioners, the most sensible place to start is with the questions one wants to answer with analytics. If the questions are about course-level engagement and interactions, the data will be most likely derived from the LMS. This requires working with a teaching center or the unit responsible for the LMS. If the questions indicate an interest in students’ attributes and performance across a spectrum of time and courses, the data will be stored in a data warehouse, or student information system (SIS). In this case, the institutional research (IR) office and decision support units would be the first points of contact.
Although obtaining and using LA may seem like yet another research obstacle to overcome, we encourage SoTL practitioners to make the effort, enrich their research and understanding of student success, and become partners with other units on their campus that are invested in the transformation of teaching and learning through this new opportunity. For educational technologists, we emphasize the need to connect SoTL practitioners with dedicated staff who are trained in research methodology and quantitative methods.
Conclusion
As LA becomes an increasingly integral part of higher education, it offers expansive opportunities for both SoTL practitioners and educational technologists to improve student success at the intersections of technology and pedagogy. The Learning Analytics Fellows Program illustrates that, with institutional support and access to comprehensive data, faculty Fellows can gain deeper insights into student behavior and success while promoting effective evidence-based teaching. This shift required ongoing support to build confidence, especially for faculty less familiar with quantitative data or big data analysis. A structured approach—focused on fostering LA skills and creating cross-disciplinary collaborations—can empower educators to explore the broader impacts of their teaching practices and address complex questions about student success that transcend individual classrooms.
A conclusive answer to whether LA-informed SoTL projects may shift teaching and learning cultures at the departmental and institutional levels may be possible in the future. We found that faculty comfort with manipulating large datasets and how faculty Fellows communicate about their projects are two outcomes that have the potential to change culture. This finding aligns with Kezar’s (2001) work on how sustainable change occurs in institutions of higher education. A shift toward departmental and institutional support for evidence-informed teaching and learning requires time, influential individuals in administration, and grassroots-based movements to change (Kezar, 2001). To start, we encourage reflecting on your own teaching practices with SoTL or big data with the following questions.
Reflective Questions
- How do you currently use learning analytics?
- Given your own preferred research paradigm(s), how might large-scale data from learning analytics support your exploration of student learning, instructional effectiveness, or curricular improvements?
- What steps can you take to become more comfortable with analyzing and interpreting large data sets?
References
Association of American Universities. (2017). Progress toward achieving systemic change: A five-year status report on the AAU undergraduate stem education initiative [PDF]. https://www.aau.edu/sites/default/files/AAU-Files/STEM-Education-Initiative/STEM-Status-Report.pdf
Bogna, F., Raineri, A., & Dell, G. (2020). Critical realism and constructivism: Merging research paradigms for a deeper qualitative study. Qualitative Research in Organizations and Management: An International Journal, 15(4), 461–484. https://doi.org/10.1108/QROM-06-2019-1778
Braun, V., & Clarke, V. (2006). Using thematic analysis in psychology. Qualitative Research in Psychology, 3(2), 77–101. https://doi.org/10.1191/1478088706qp063oa
Carnegie Classification of Institutions of Higher Education. (2024). Indiana University-Bloomington. https://carnegieclassifications.acenet.edu/institution/indiana-university-bloomington/
Corbo, J. C., Reinholz, D. L., Dancy, M. H., Deetz, S., & Finkelstein, N. (2016). Framework for transforming departmental culture to support educational innovation. Physical Review Physics Education Research, 12, Article 010113. https://doi.org/10.1103/PhysRevPhysEducRes.12.010113
Felten, P. (2013). Principles of good practice in SoTL. Teaching & Learning Inquiry, 1(1), 121–125. https://doi.org/10.2979/teachlearninqu.1.1.121
Kezar, A. J. (2001). Understanding and facilitating organizational change in the 21st century: Recent research and conceptualizations (Vol. 28) [PDF]. Jossey-Bass. https://files.eric.ed.gov/fulltext/ED457711.pdf
Kezar, A., & Eckel, P. D. (2002). The effect of institutional culture on change strategies in higher education: Universal principles or culturally responsive concepts? The Journal of Higher Education, 73(4), 435–460. https://doi.org/10.1080/00221546.2002.11777159
Kuh, G., O’Donnell, K., & Schneider, C. G. (2017). HIPs at ten. Change: The Magazine of Higher Learning, 49(5), 8–16. https://doi.org/10.1080/00091383.2017.1366805
Lattuca, L. R., & Domagal-Goldman, J. M. (2007). Using qualitative methods to assess teaching effectiveness. New Directions for Institutional Research, 2007(136), 81–93. https://doi.org/10.1002/ir.233
Lodge, J. M., Horvath, J. C., & Corrin, L. (Eds.). (2019). Learning analytics in the classroom: Translating learning analytics research for teachers (1st ed.). Routledge.
Long, P., & Siemens, G. (2011). Penetrating the fog: Analytics in learning and education. Educause, 46(5), 31–40. https://er.educause.edu/articles/2011/9/penetrating-the-fog-analytics-in-learning-and-education
Miller-Young, J. (in press). Asking “how” and “why” and “under what conditions” questions: Using critical realism to study learning and teaching. Teaching and Learning Inquiry.
Poole, G., & Simmons, N. (2013). Contributions of the scholarship of teaching and learning to quality enhancement in Canada. In R. Land & G. Gordon (Eds.), Enhancing quality in higher education. Routledge.
Rehrey, G., Groth, D., Shepard, L., Fiorini, Stefano, & Hostetter, Carol. (2018). Implementation of a student learning analytics fellows program. In A. Pardo, K. Bartimote, G. Lynch, S. Buckingham Shum, R. Ferguson, A. Merceron, & X. Ochoa (Eds.), Companion proceedings of the 8th international conference on learning analytics & knowledge (pp. 1–9). Society for Learning Analytics Research. http://bit.ly/lak18-companion-proceedings
Rehrey, G., Groth, D., Shepard, L., & Hostetter, C. (2019). The scholarship of teaching, learning and student success: Big data and the landscape of new opportunities. In J. Friberg & K. McKinney (Eds.), Applying the scholarship of teaching and learning beyond the individual classroom level (pp. 182–200). Indiana University Press. https://doi.org/10.2307/j.ctvpb3w0t.13
Rehrey, G., Molinaro, M., Groth, D., Shepard, L., Bennett, C., Code, W., Reynolds, A., Squires, V., & Ward, D. (2020). Supporting faculty adoption of learning analytics within the complex world of higher education. In D. Gibson & D. Ifenthaler (Eds.), Adoption of data analytics in higher education learning and teaching (pp. 221–238). Springer. https://doi.org/10.1007/978-3-030-47392-1_12
Sclater, N. (2017). Learning analytics explained. Routledge.
Shepard, L., Rehrey, G., Groth, D., & Reynolds, A. M. (2019). Evaluating a learning analytics research community: A framework to advance cultural change. In A. Pardo, K. Bartimote, G. Lynch, S. Buckingham Shum, R. Ferguson, A. Merceron, & X. Ochoa (Eds.), Companion Proceedings of the 9th International Conference on Learning Analytics & Knowledge. Society for Learning Analytics Research.
Society for Learning Analytics Research. (2011). What is learning analytics? https://www.solaresearch.org/about/what-is-learning-analytics/
Xiao, R., & Kaganovich, M. (2020). Satisfactory grade option: Choice determinants and consequences [Learning analytics completion report]. Indiana University.
Yeo, M., Miller-Young, J., & Manarin, K. (2023). SoTL research methodologies: A guide to conceptualizing and conducting the scholarship of teaching and learning. Taylor and Francis. https://doi.org/10.4324/9781003447054
Media Attributions
All images in this chapter have been created by the author, unless otherwise noted below.
Long Descriptions
Figure 6.1 Long Description: Short-term outcomes in attitudes and beliefs—Documented insights and awareness of student behavior and student success; Mid-term outcomes in behaviors—Observed course and curriculum changes due to LA insights; Long-term outcomes in department norms—Evidence that departments rely on LA as part of a cultural norm. [Return to Figure 6.1]
Figure 6.2 Long Description: The pie chart is separated into the following categories:
- Tenure and Tenure Track: 41%
- Professor: 19%
- Associate Professor: 13%
- Assistant Professor: 6%
- Emeritus: 3%
- Non-Tenure and Tenure Track: 36%
- Senior Lecturer: 19%
- Lecturer: 14%
- Adjunct: 3%
- Staff, Graduate Employees, and Administrators: 23%
- Coordinator: 7%
- Director of Undergraduate Studies: 4%
- Librarian: 3%
- Graduate Student: 3%
- Graduate Instructor: 3%
- Data Analyst: 1%
- Post-Doc: 1%]
Figure 6.3 Long Description: The typical faculty perspective is that students attend a large introductory course and then move onto either the next applicable course or other unrelated courses and majors. Faculty do not consider students’ patterns and behaviours beyond the classroom.
After introducing SoTL, the faculty perspective changes to consider the students’ patterns and behaviours both in and beyond the classroom. These changes can be classified as follows (from smallest to largest): course (micro), program (meso), institutional (macro), and career (mega).
Figure 6.4 Long Description: Salient codes and themes from the focus groups include:
- Oval codes:
- Lasting personal change, which leads to confidence in communicating with peers about teaching and learning
- Myth-busting/confirming
- Growth mindset about T&L practices
- Awakening/Awareness
- Empowered to initiate and refine research
- Improved comfort with quant methods
- Began to propose and evaluate solutions to problems
- Rectangle codes:
- Changing T&L culture
- Dissemination of work in faculty forums
- Rounded rectangle codes:
- Making data-informed changes in course and dept
- Sharing ideas in informal settings with colleagues
- Faculty participants recruiting others]
